You’re solving a math problem, scrolling through your notes, and suddenly you see the term IQR. And just like that, your brain goes, “Wait… IQR? Is this another mystery like PEMDAS drama?” 😅 Trust me, I’ve been there — staring at a box-and-whisker plot wondering why math suddenly decided to speak in three-letter codes.
If you’ve ever paused during homework or while analyzing data in class, you’re not alone.
Quick Answer:
IQR means Interquartile Range. It’s a math and statistics term that measures how spread out the middle 50% of your data is. It helps identify consistency, variation, and outlier detection.
What Does “IQR” Mean in Math?
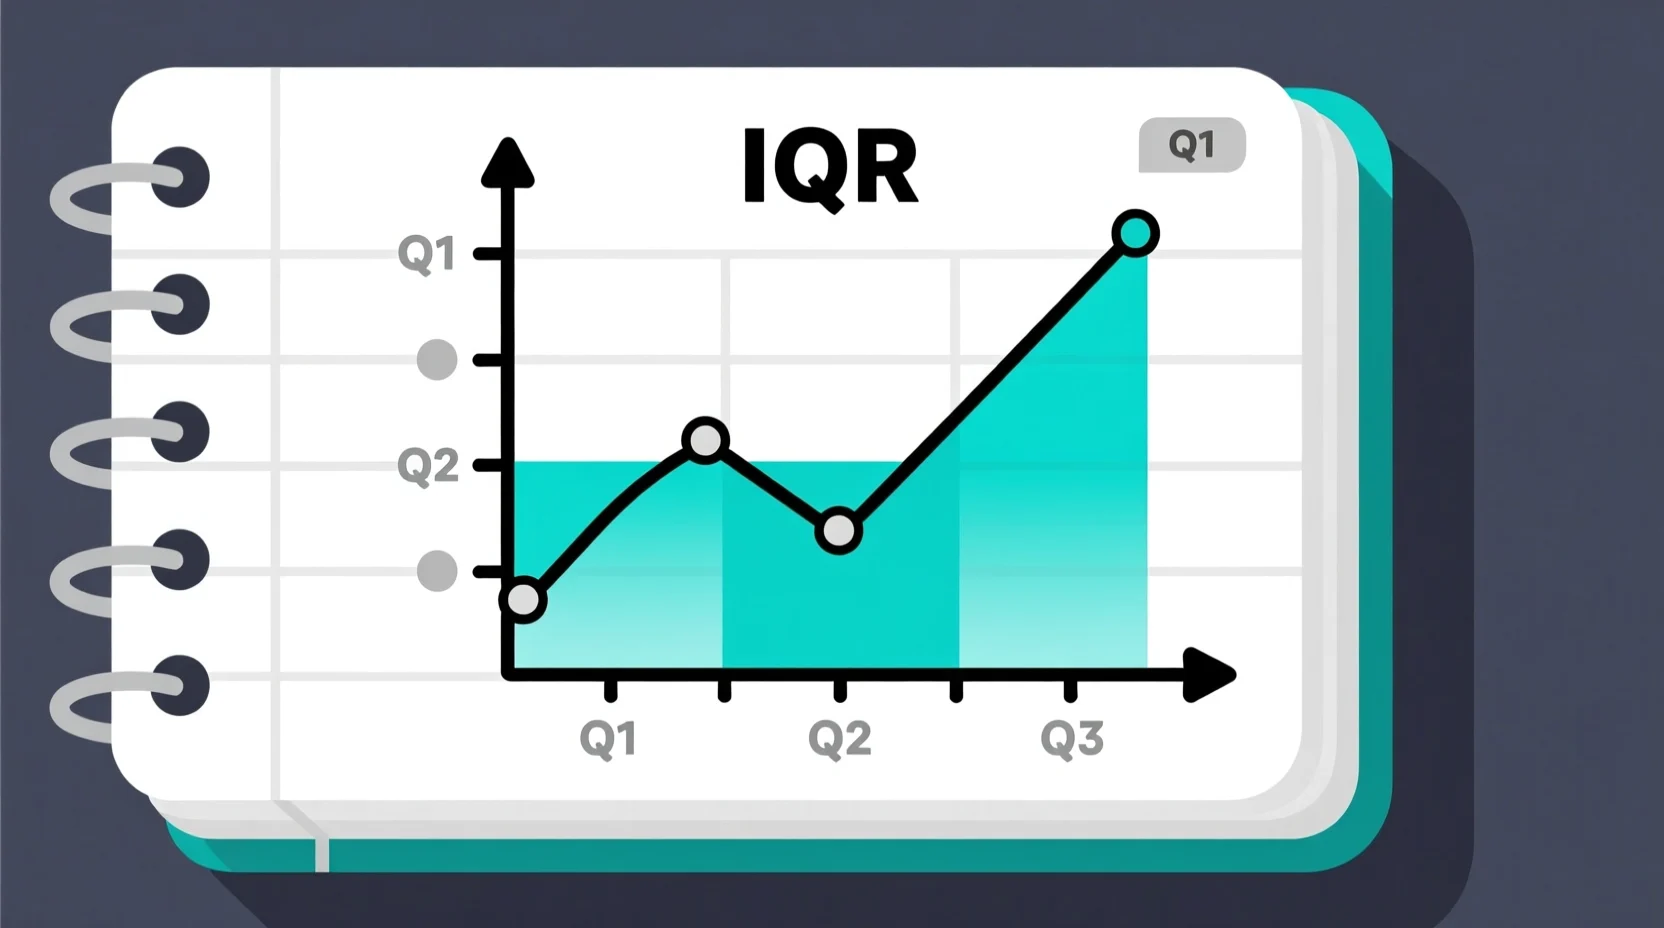
IQR stands for Interquartile Range, a measure used in statistics to understand how spread the central portion of data is. It focuses on the values between the first quartile (Q1) and the third quartile (Q3).
Formula:
IQR = Q3 – Q1
This tells you how “tight” or “wide” the data is around the center.
Example:
If Q1 = 10 and Q3 = 18
IQR = 18 – 10 = 8
This means the middle half of the dataset spreads across 8 units.
In short:
IQR = Interquartile Range = Spread of Middle 50% of Data
Where Is “IQR” Commonly Used?
IQR is widely used in math, statistics, and data science classrooms — plus real-world fields dealing with numbers.
You’ll see IQR used in:
- 📘 School math problems
- 📝 Statistics homework and exams
- 📊 Box-and-whisker plots
- 🎓 SAT / ACT math sections
- 💻 Data science
- 📈 Research and analytics
- 🧪 Scientific experiments
Formality Level:
IQR is 100% formal and used in academic, scientific, and professional settings.
Examples of “IQR” in Conversation
A: “ugh this data set is huge 😭 what do i do first??”
B: “find Q1 and Q3 then get the IQR, it’ll make it easier 👍”
A: “my teacher said outliers are based on IQR??”
B: “yes bro multiply IQR by 1.5 to find them 😭”
A: “what’s the IQR of this set again?”
B: “Q3 minus Q1, super simple 💀”
A: “box plot looking weird”
B: “check the IQR, maybe the data is super spread out”
A: “does IQR matter more than mean?”
B: “for outliers? YES.”
A: “i forgot how to find IQR lol”
B: “same, google is my best friend 💀😂”
When to Use and When Not to Use “IQR”
✅ When to Use
- When analyzing data distribution
- When identifying outliers
- When comparing two data sets
- When summarizing statistical spread
- When plotting box-and-whisker diagrams
❌ When NOT to Use
- For very small data sets
- When mean and standard deviation are required
- When data is heavily skewed and quartiles don’t help much
- When measuring central tendency (use median/mean)
Context Comparison Table
| Context | Example Phrase | Why It Works |
|---|---|---|
| School Homework | “Find the IQR to measure the spread.” | Correct academic usage |
| Exam Explanation | “The IQR shows variability of the middle data.” | Formal and precise |
| Data Science | “We removed outliers using the 1.5×IQR rule.” | Common statistical practice |
| Casual Text | “what’s IQR again? 😭” | Informal but accurate |
Similar Terms or Alternatives
| Term | Meaning | When to Use |
|---|---|---|
| Range | Difference between largest and smallest value | General spread measurement |
| Variance | Measures how far data points are from the mean | Advanced statistics |
| Standard Deviation | Average distance from the mean | Scientific & research use |
| Median | Middle value in sorted data | Central tendency |
| Quartiles (Q1, Q2, Q3) | Values dividing data into 4 equal parts | Needed to calculate IQR |
| Mode | Most frequent value | Categorical or repeated data |
FAQs
1. What is IQR used for?
To measure how spread out the middle portion of data is.
2. How do I calculate IQR quickly?
Find Q1 and Q3, then subtract: IQR = Q3 – Q1.
3. Is IQR the same as range?
No. Range considers all data; IQR focuses on the middle 50%.
4. Why is IQR important?
It helps detect outliers and understand variability.
5. Can you use IQR for any dataset?
Yes, but it works best for medium or large datasets.
6. What is the 1.5×IQR rule?
Values below Q1 – 1.5×IQR or above Q3 + 1.5×IQR are outliers.
7. Is IQR used in box plots?
Yes, the box itself represents the IQR.
Conclusion
IQR is one of the most important concepts in math and statistics when analyzing data spread and detecting outliers. By focusing on the middle 50% of your values, it gives a cleaner and more reliable view of how consistent your dataset truly is. Whether you’re studying for an exam, working on a class project, or interpreting real-world statistics, mastering IQR makes data analysis far easier — and a lot less intimidating.

